Every loyalty metric, on one screen.
Watch members, points, redemptions, and ROI update as your programs run. Build the views your team needs, schedule the reports your board wants, and act on what the numbers say — without exporting a thing.
Reporting that keeps up.
Real-time dashboards
Members, active campaigns, point liability, and redemption update the moment a sale clears. No overnight batch, no stale numbers in the morning standup.
Build your own views
Drag the metrics that matter into a custom dashboard per team. Marketing sees lift and ROI, finance sees liability and breakage.
Cohort and funnel analysis
Track retention by signup month, funnel drop-off, and tier movement over time, and see what's actually moving the needle.
Scheduled reports
The weekly board deck and the daily ops summary land in the right inboxes as PDF or CSV — built once, sent on time.
From raw events to boardroom-ready in four steps.
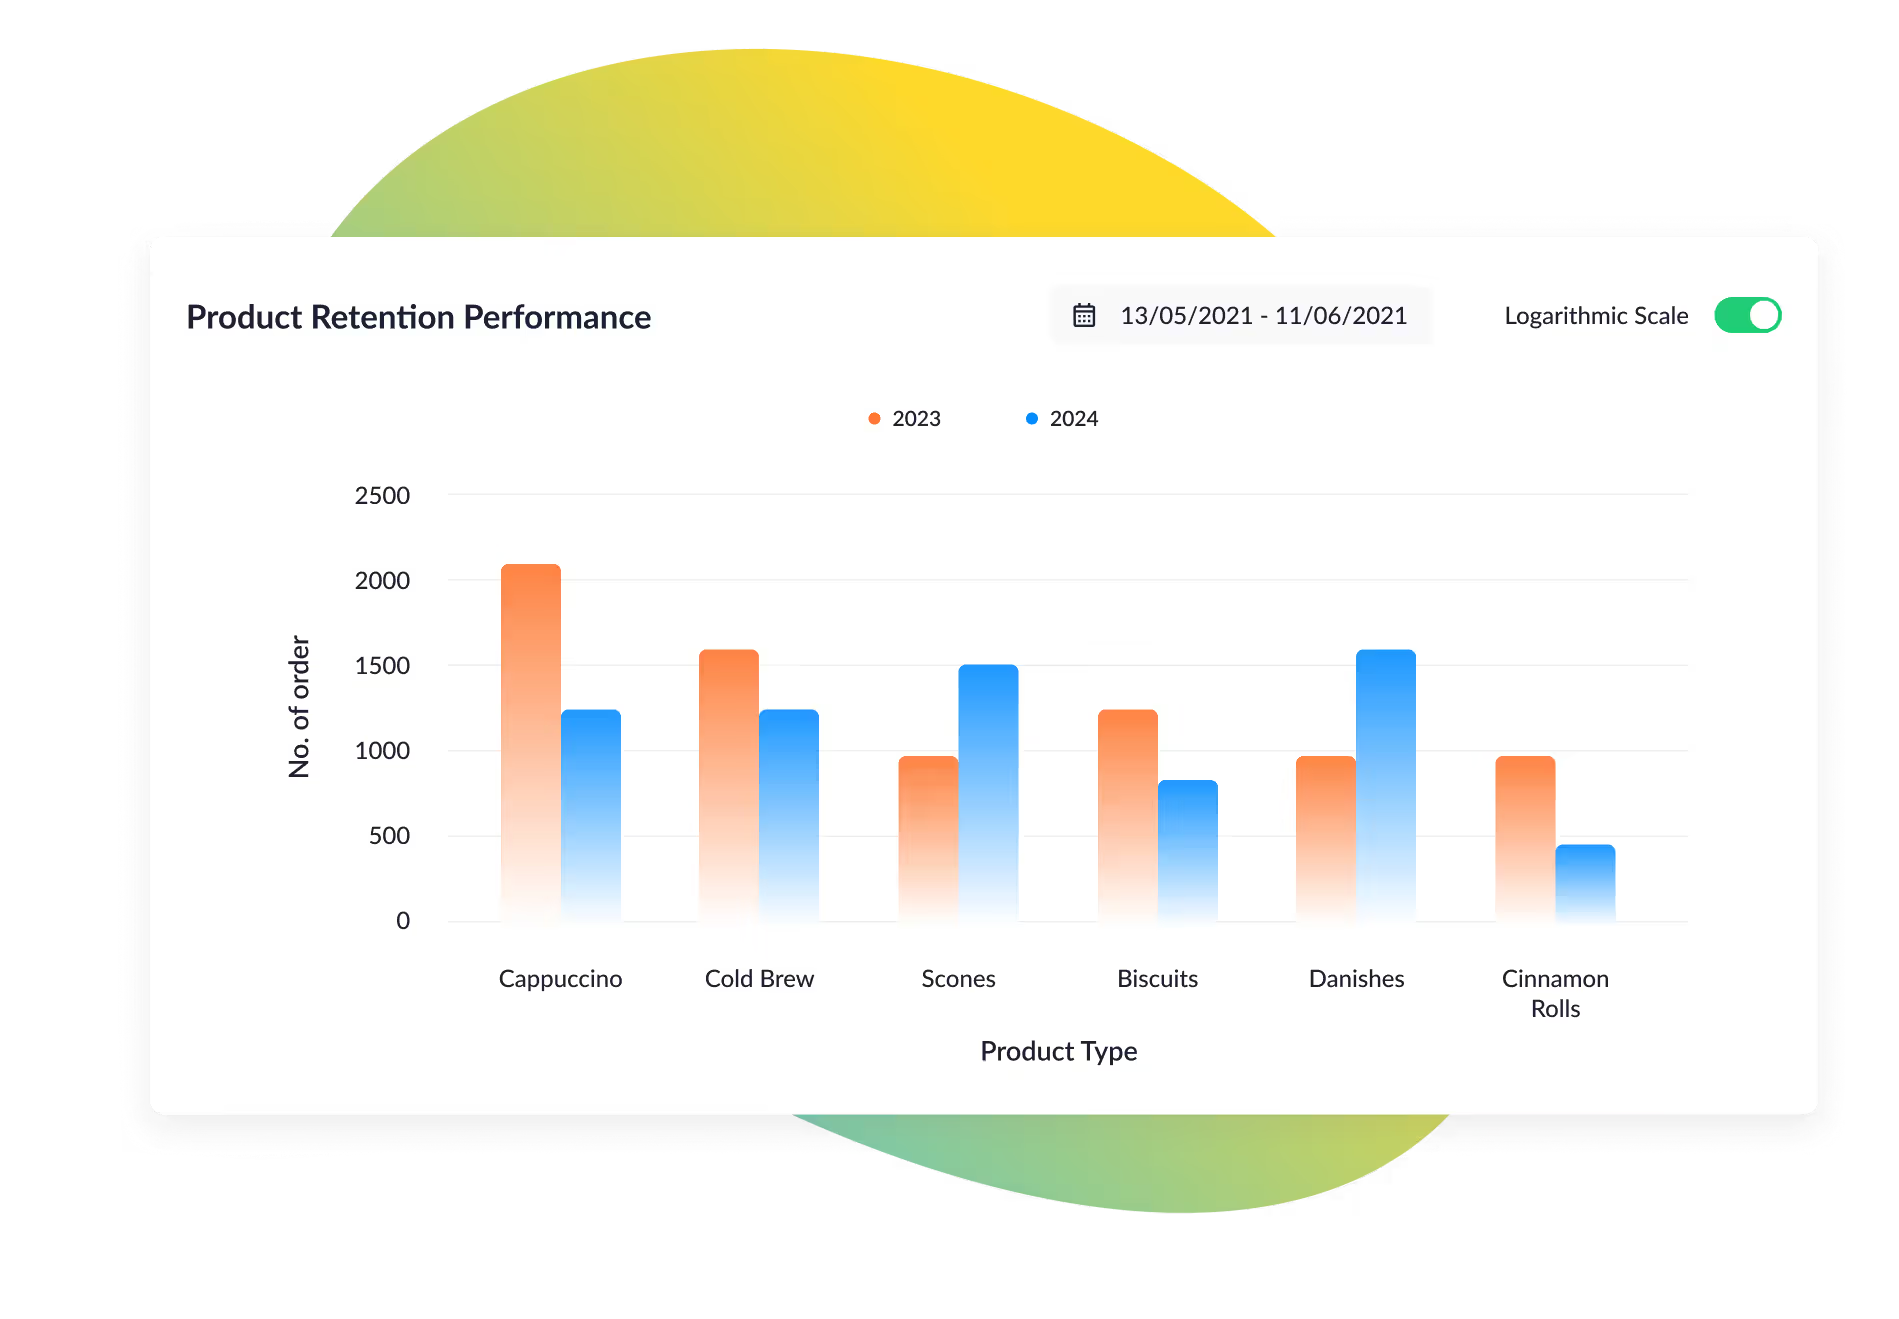
Everything's already tracked
Every earn, burn, signup, and redemption flows into reporting on its own. No tagging project, no manual logging.
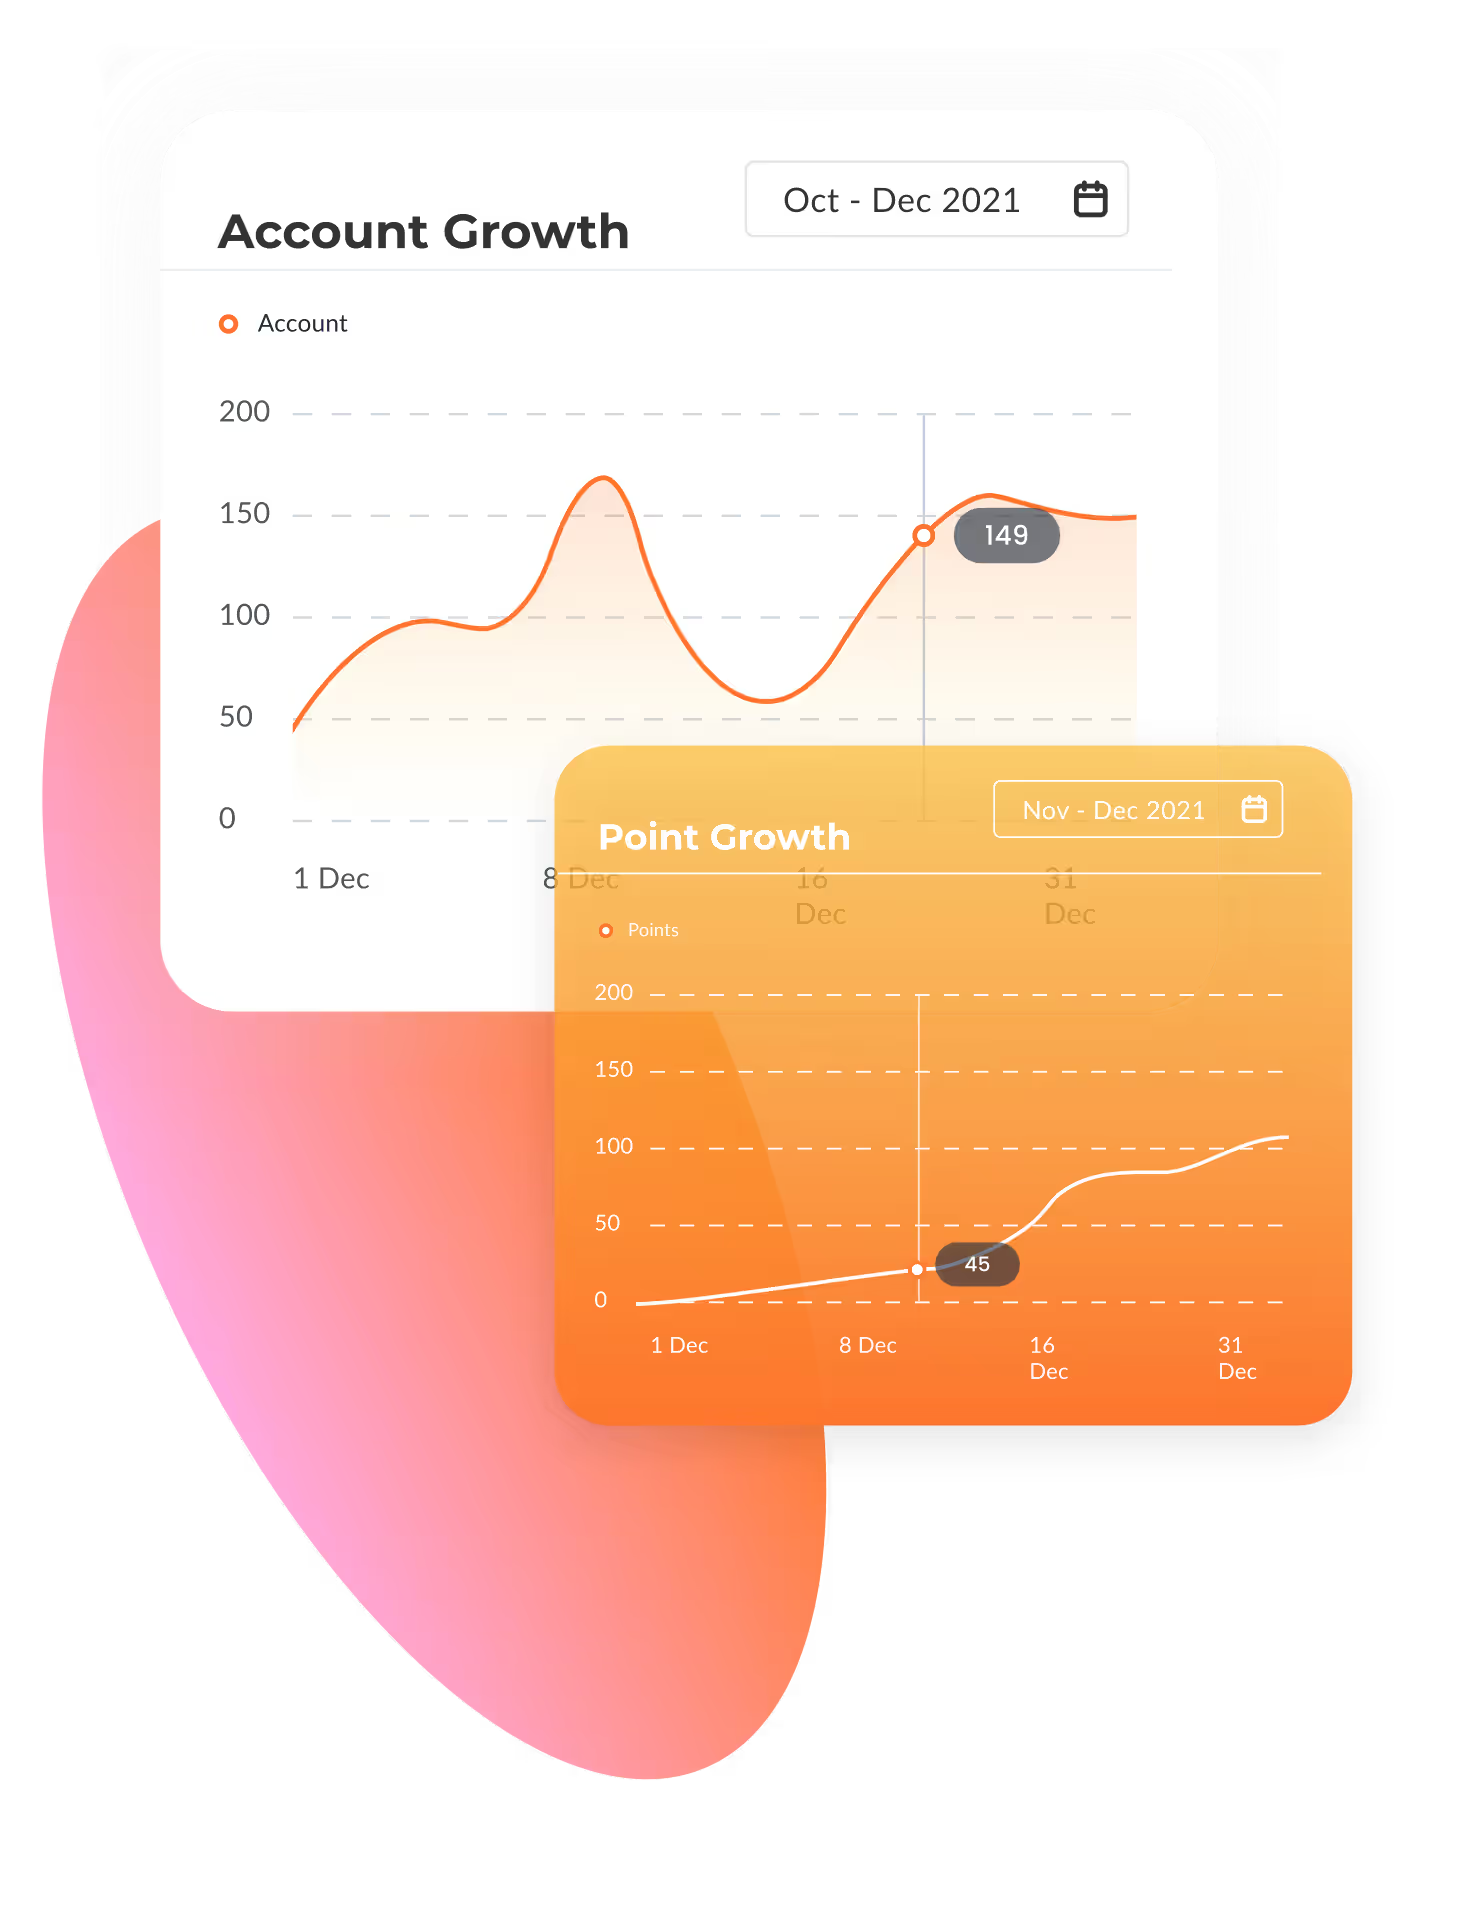
Build your dashboards
Drag metrics and charts onto a view per team, then filter by segment, campaign, or date range.
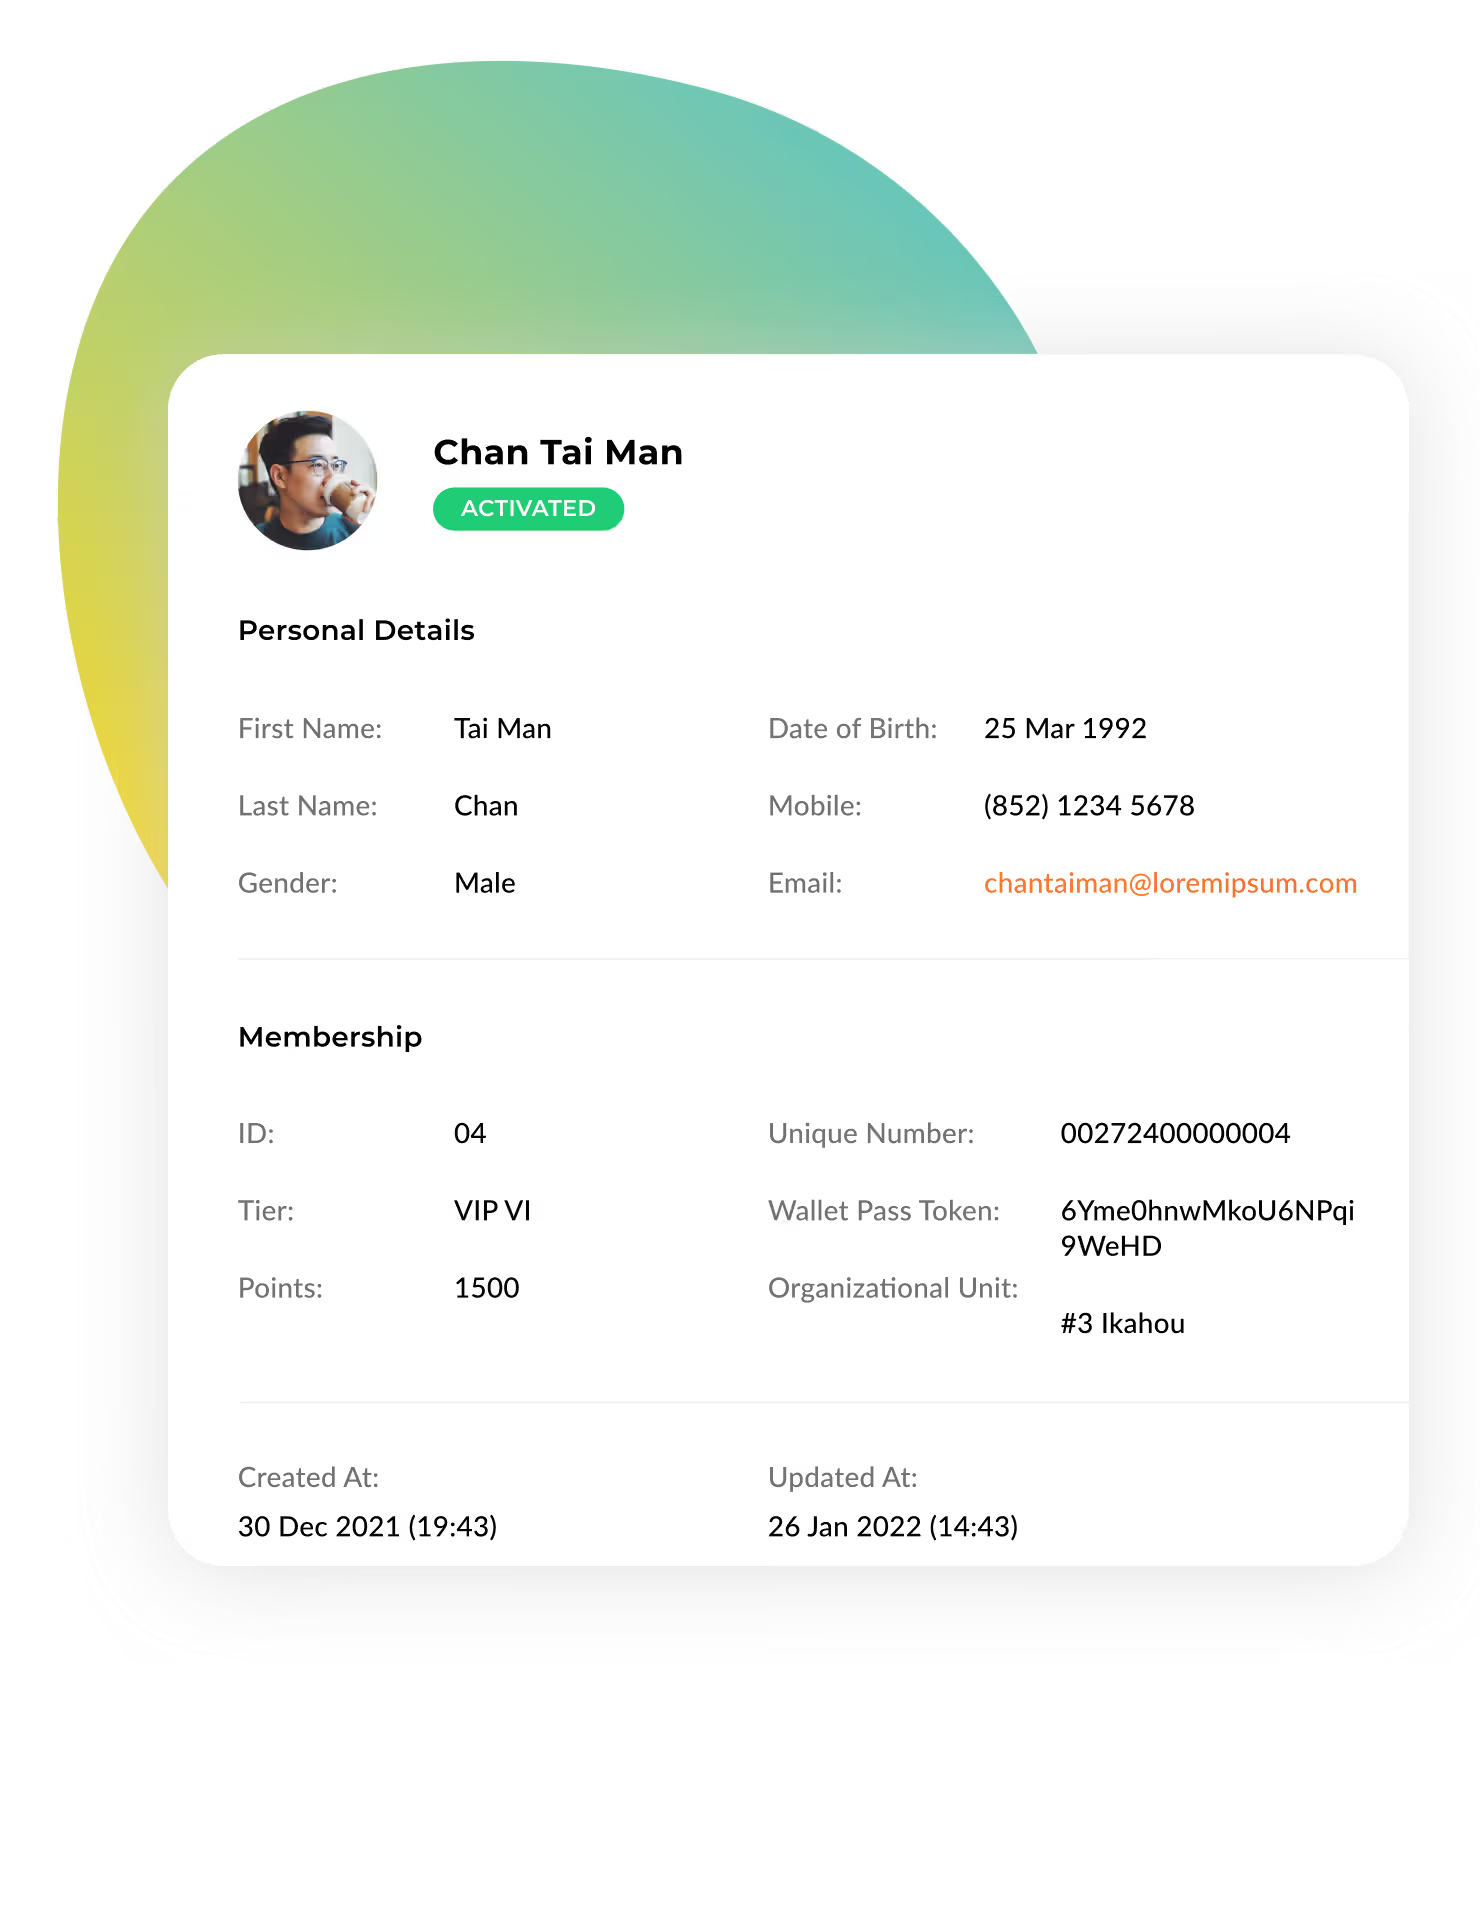
Drill into the why
Click any number to break it down by cohort, channel, or tier, and find the driver behind the trend.

Share and schedule
Send a live link, export to PDF or CSV, and schedule recurring reports straight to stakeholders' inboxes.
One source of truth. Faster decisions. No exports.
Decisions in minutes, not weeks
Live dashboards mean your team acts on today's data, not last month's. Kill a dud campaign and double a winner while it's still running.
One number everyone trusts
Marketing, finance, and ops read the same real-time figures, so the standup is about what to do next — not whose spreadsheet is right.
The weekly export, retired
Custom views and scheduled reports replace the CSV-and-pivot ritual. The deck builds itself and lands on time.
faster campaign decisions for teams working from live dashboards versus weekly exports.
of loyalty events captured automatically — no tagging projects, no manual logging.
Reporting that fits every team.

About dashboard & report.
Live. Earn, burn, signup, and redemption events stream into reporting in real time, so the dashboard you check at 9am reflects the sale that cleared at 8:59.
Yes. Build unlimited custom views and assign them per team or role. Marketing sees lift and ROI, finance sees liability and breakage, ops sees redemption volume.
Yes. Save any view as a recurring report and have it delivered as PDF or CSV to the inboxes you choose, on the schedule you set — daily, weekly, or monthly.
Put every metric on one screen.
See your whole loyalty program live, and act on it in minutes. Book a demo.